▫️ The One Number That Separates Nvidia From Cisco in 1999
Every major strategist is running the same comparison. The answer decides whether you have a year or a month.


▫️ THE DRILL BIT
Ten companies now hold 41% of the S&P 500.
AI draws 87% of all venture capital.
Nvidia trades at 35 times earnings.
Cisco traded at 132 times in 2000.
▫️ THE CORE TOPIC
For three years, one trade carried the market. Buy artificial intelligence. Buy the chips, the clouds, the power plants that feed them. The strategy worked so well that it bent the shape of the entire index.
The numbers are hard to ignore. The top ten companies in the S&P 500 now account for 34% of all index profits, a share that has doubled since 1996, and 41% of its market value. AI companies represent nearly 87% of all venture capital funding. By almost any measure, AI is no longer influencing the market. It is the market.
That concentration has Wall Street reaching for history. Every major strategist is running the same comparison: is this 1997, with years of gains ahead, or 1999, months from the peak? The honest answer is that the question itself reveals how stretched the structure is.
▫️ THE MECHANISM
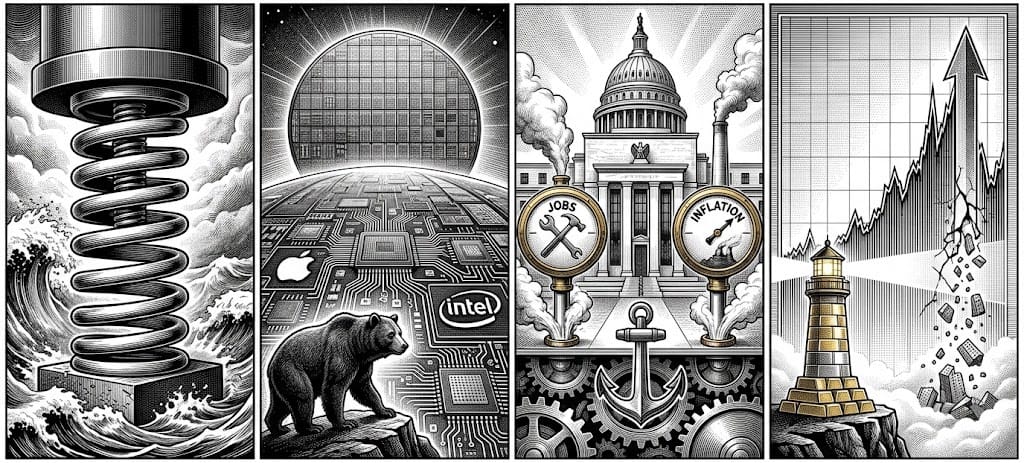
The 1997-versus-1999 debate is not academic. Each side rests on measurable structural facts. Four gears drive the argument.
- Concentration is real and extreme. The market is more concentrated than at any point since the 1960s. Ten names hold 41% of the index.
- Earnings back this rally, unlike 1999. S&P 500 earnings revision breadth hit a four-year high at 24%. Median earnings growth runs at 16%.
- Valuations stay below dot-com extremes. Goldman notes breadth is far less narrow than 1999-2000. The mania has not reached March 2000 levels.
- The buildout is infrastructure, not adoption. Capital still funds hardware and data centers. The revenue phase has barely begun.
The bull case and the bear case are both true. That is what makes this dangerous.

▫️ THE CASE FILE
Consider Cisco Systems in March 2000. The networking giant was the Nvidia of its day, selling the picks and shovels of the internet buildout. At the peak, Cisco traded at roughly 132 times forward earnings while generating about $5 billion in free cash flow.
The Nasdaq crashed 77% from its March 2000 top, bottoming in October 2002. Cisco lost nearly 90% of its value and has never reclaimed its 2000 high, twenty-six years later.
Today Nvidia trades near 35 times forward earnings with roughly $60 billion in free cash flow. The same story can carry a very different price.
▫️ THE PRESSURE TEST
The comparison cuts both ways. Honest investors weigh each risk.
- Concentration amplifies the fall. If a few mega-caps miss, the index drops harder than diversified history suggests.
- Revenue must justify the capex. Hyperscalers spent nearly $300 billion in 2025. If monetization lags, the buildout becomes a write-down.
- Energy is the wildcard. Triple-digit oil and rising power costs feed data-center economics.
- "Different this time" is the oldest trap. Every bubble felt justified at the peak.
These risks are real. But investors who hold assets uncorrelated to the AI trade have historically weathered the turn better than those who assumed the rally had no end.
▫️ AUTHOR'S LENS
I traded through March 2000. The arguments then sounded exactly like the arguments now. Smart people explained why the old rules no longer applied. Some were right about the technology and still lost everything on the price.I do not know if this is 1997 or 1999. I know that when ten companies are the market, the rest of your portfolio is your insurance.Build the structure. Ignore the noise. |  |
▫️ PAST ISSUES