The first figure on BP's Gulf well was 1,000 barrels a day.

 |  | Susan Price & Marcus Grant September 29, 2026 |
THE SHORT VERSION |
• A well under the Gulf of Mexico opened in 2010. • The first public figure was 1,000 barrels a day. • The settled figure was 4,900,000 barrels in all. • The well itself never changed between the two. |
THE SETUP |
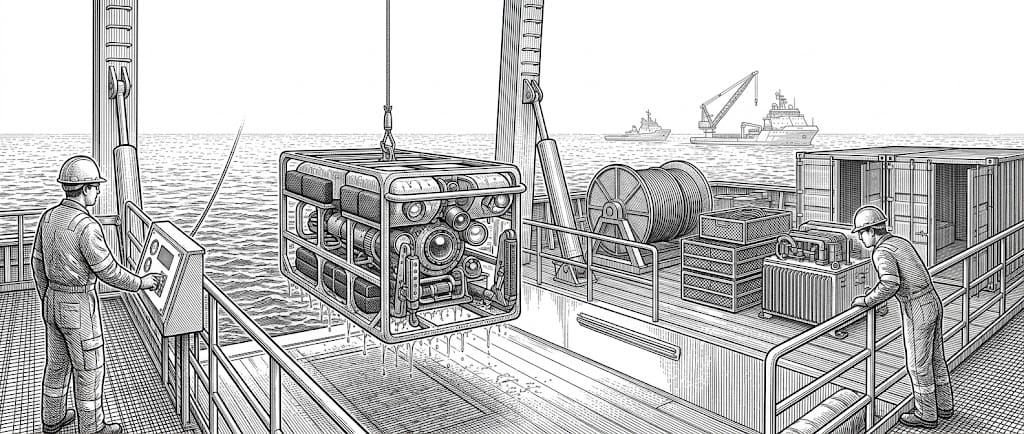
On the evening of April 20, 2010 the Coast Guard command centre in New Orleans took a report of an explosion aboard a mobile offshore drilling unit called Deepwater Horizon. Eleven men aboard did not come home. The unit sank two mornings later and left a sheen one mile by five on the water above it. Then came the question that ran the next three months: how much oil was leaving the well beneath, and how fast it was coming out. Remotely operated vehicles went down to look. The first pass found nothing, because the riser had not yet been traced, and the ranking federal officer on the scene told a television camera on April 23 that no crude was emanating from the wellhead. Over the following day the vehicles followed the riser and found two openings in it. On April 24 the Coast Guard and BP put out a figure: up to 1,000 barrels a day. Neither of them showed how it had been worked out. |
THE TIMELINE |
Every row below comes from one document, staff working paper number three of the National Commission on the BP Deepwater Horizon Oil Spill and Offshore Drilling, released on October 6, 2010 and updated on January 11, 2011. Its authors had the internal records, the transcripts of the briefings and the science teams' own notes, and they set the official figures out in order. Read the second row first. On April 28 the official figure moved from 1,000 barrels a day to 5,000. It rested on a single unsolicited page written by one scientist at the National Oceanic and Atmospheric Administration, who told the people who took it that his figure was very rough. It stood as the official one for the next month. |
THE BREAK |
The well was the same well all summer. What moved was the figure, and four things kept it moving. • Two figures at once. On April 23, the day before the public got 1,000, an internal Coast Guard situation report and a dry-erase board in a NOAA room in Seattle both carried 64,000 to 110,000 barrels a day. The operation ran on one and the public heard the other. • The working was never shown. Neither the Coast Guard nor BP published the data or the arithmetic behind 1,000 barrels a day, so nobody outside could check it or correct it. • One page, one month. The 5,000 figure came from an unsolicited page and stood from April 28 until May 27, when a federal group finally published one built on three separate methods. • Outside arithmetic arrived first. Scientists with no part in the response, working from seconds of public video, were at 25,000 barrels a day by the end of April. |

WHO PAID |
The eleven men who died on April 20 were beyond any of this. The figure was never about them. What the figure did decide was the early handling. The National Incident Commander later wrote that the first dispersant decisions were taken against 5,000 barrels a day, and that the larger figures published later pushed responders to reconsider how dispersant and the other methods were being used. The Commission staff also found that the early undercount held back planning for the cofferdam and, above all, for the top kill. The figure itself was settled in the end. The peer-reviewed assessment published in March 2011 left the August 2010 numbers standing: 53,000 barrels a day in the days before the well was shut on July 14, and 4,900,000 barrels over the three months, give or take a tenth. |
THE PATTERN |
• Ask who made the figure. A figure with no named method behind it is one nobody outside can correct. • Watch for two sets of books. When the figure guiding the work and the figure given out are different, the second one is decoration and the first one is the job. • An early figure sticks. The first one published becomes the mark every later one is measured against, whatever it rested on. • Some numbers are weighed, some argued. Gold on a scale gives the same answer to everyone who asks; a flow under 5,000 feet of water gives the answer of whoever did the arithmetic. I spent 1980 on a floor where the board above us and the tape in our hands disagreed for minutes at a time, and everybody worked the tape. When a figure matters, ask who produced it, what they had to work from, and whether anyone was handed a different one. |