▫️ The Debt Crossed $36 Trillion. Nobody Plans to Stop.
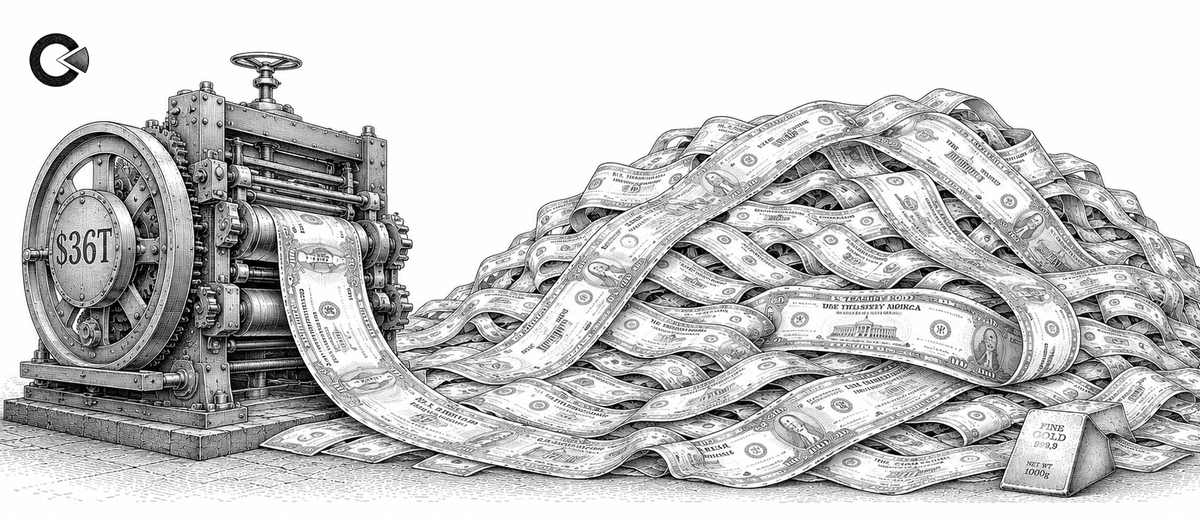
Federal debt has passed $36 trillion, and the yearly gap no longer waits for a recession to appear.

▫️ THE CORE TOPIC
For most of the postwar era, deficits were a tool, not a habit. Washington ran red ink during recessions, then closed the gap when growth returned. Debt rose and fell with the cycle. The math worked because the shortfalls were temporary.
That discipline is gone. Federal debt has crossed thirty-six trillion dollars. The annual deficit runs near two trillion, in good years and bad. Interest on that debt is now one of the largest items in the budget, competing with everything else the government wants to fund.
The cause is structural, not partisan. An aging population, fixed defense and entitlement commitments, and higher interest rates have locked the gap in place. No single party built it, and no single vote closes it.
That same spending also mints winners. A new generation of defense and AI contractors now sits on tens of billions in federal contracts, the kind of backlog early investors chase hard. For your capital, the question is simpler. When a government spends what it does not have, what holds its value?
▫️ THE MECHANISM
Deficits reach your portfolio through a few connected gears.
- Constant issuance. To cover the gap, the Treasury sells new bonds every single week, adding to a pile that no longer shrinks in any year.
- Rising interest cost. Higher rates mean the debt now costs more to carry than most federal programs, and that cost compounds on itself.
- The buyer problem. Foreign appetite for Treasuries has softened, so a growing share of the debt has to find a home among domestic buyers instead.
- The gold answer. The most conservative buyers on earth responded first: central banks bought 863 tons in 2025, a fourth straight heavy year, and a record share plan to add more. Even Washington's own former insiders now steer private money toward the metal.
When the supply of money grows faster than the supply of trust, hard assets get the bid.
▫️ THE CASE FILE
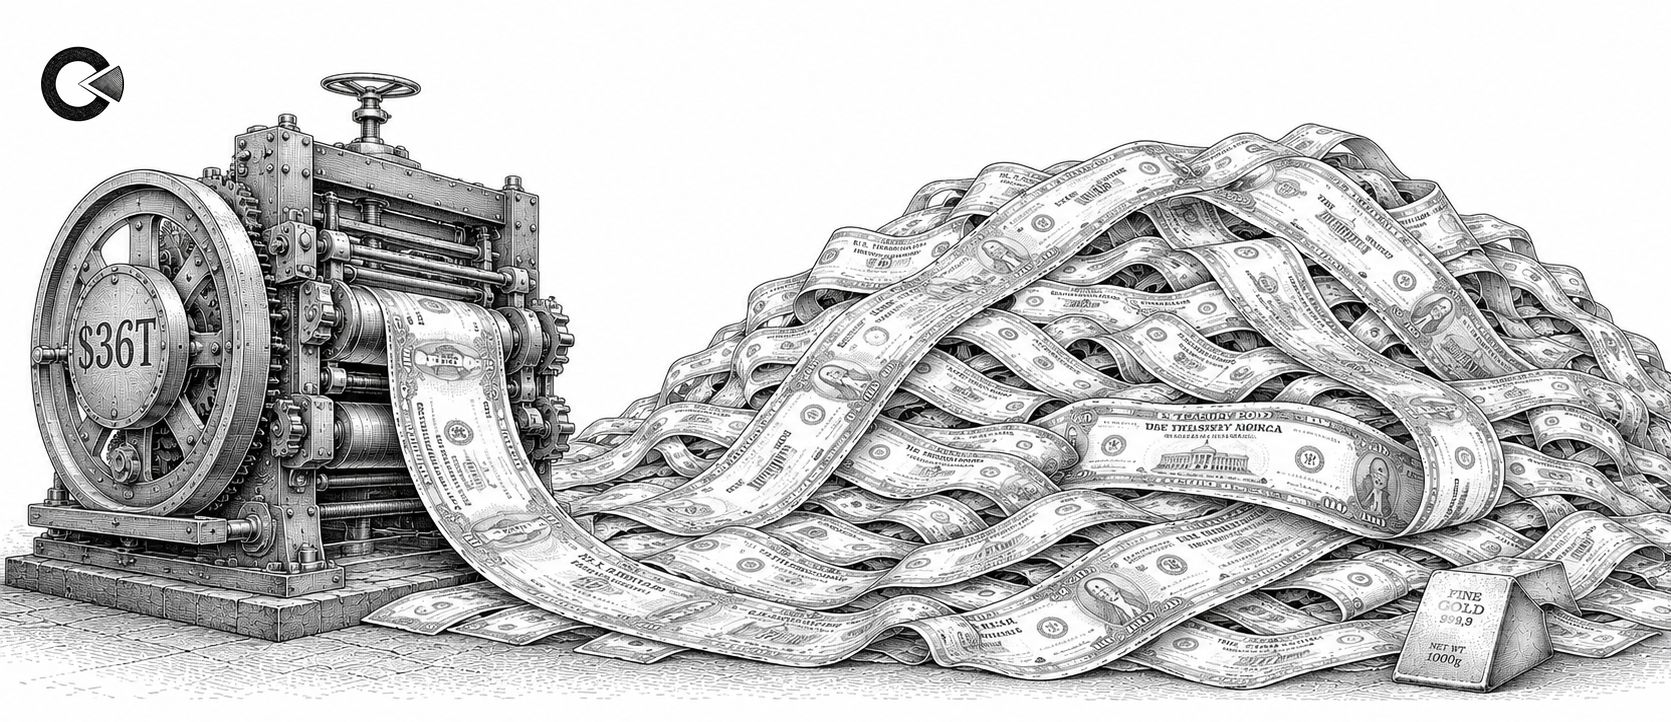
The United States left World War Two with federal debt near 119 percent of GDP, higher than the ratio today. There was no austerity program and no default.
Instead, the Federal Reserve capped Treasury yields close to 2.5 percent while inflation ran into double digits, reaching roughly 14 percent in 1947. Savers holding cash and bonds earned a fixed, low return while prices climbed around them. The real value of the debt shrank year after year. By the mid-1950s the burden had fallen sharply, paid down not by taxpayers but by everyone holding dollars.
The debt was never actually repaid. It was inflated away. The bondholders financed it without ever being asked.
▫️ THE PRESSURE TEST
- Timing is uncertain. Heavy debt loads can persist for decades before they bite. Japan has carried far higher ratios for thirty years without a crisis.
- Bonds can still rally. In a sharp recession, Treasuries can gain even as the long-term math worsens. The path is not a straight line down.
- A crowded thesis. The deficit story is widely understood, and the easy gains in some hedges may already be priced in.
- Policy can surprise. A real growth surge or genuine spending restraint, however unlikely it looks now, would change the trajectory.
None of this breaks the core lesson. A government that must inflate its way out of its obligations rewards the people who own assets it cannot print, and gold remains the cleanest of them.
▫️ AUTHOR'S LENS
I started on the trading floor when a deficit still felt like an emergency. It does not anymore. I have watched the number cross every threshold once called impossible, and the world kept turning each time. That is the trap. Slow erosion never feels like a crisis until you measure it in decades.I do not bet on the moment it finally breaks. I bet on the direction. I keep my foundation in what no government can create with a keystroke, and let the deficit do what deficits have always done.Build the structure. Ignore the noise. |  |
▫️ PAST ISSUES

Click to access past briefings, conclusions, and charts. Analytics updated weekly for structural analysis and market understanding.
T9AEVE9ye3WqHLFYkMOS72vgQ8IF0AHAt3WdsF6UhObv6S38eMRQmZT7Jsg88dX9Oim0N4I8hCSASdzgjCJvm6TrHOIdeGwI3o13rLLYL24YlQtiHyYUNISTTBTGAzxLbAMfCI01pLAbUKKEOoDWlAuP7FbCyToMGmANFbH7VCQRCH0r0uXo2SwL5BS5lY9cHbVyXah5yDKnXqEOo1kIFGBqFMh5YazCoWgyEZZgqF0HsCRK2OFMZuwEw9qNuuYi5Xdo9gysHh479ZbRHv2Ti3yZ7NQep4vUAMKkxpZSG8SCjtvhmdUFI15lFoCBdIDkjGr6byVWUOZSkMeuZqwm4GerfkJWd4e0F2PVPxe9N1V3l2dBWr3J8RFF4S6KmjdZWePgyEu5GHzEo0qzvWRjqzGyJXRiNuVOIG1hu2VlCrIZd1x1KPyjrCodcbpoIXq9ApGa5AYZ2vHfjLTnxjJo9upI2V4A8csM6UypbJJIzUFR3v674mArVxAJ1XSK7c1UwbqqIkpCWIKViXKJln2xoZpAMZUo6iqn9sLAI7i24f1jjxJxSsVdvWYKJ56HIeGvfSgrycIaDnL0LVewJvjLLIOukjgOAYXe39AP7ws1GZ9AYj1lywIwkfOT9wxTCBYnVpawUmx4LmIDUwfOxbslGPijhpLDNeWTwqQ7bbV3C0OISg94OIRjD7oo5lybxSEtpbzMyAXXZo3Seu9QR6HvkkoectpYCbFiNuT6S86uNfJPiGmxWZTzz810mLhlwqdqhQU7tD0aXRS21FSY2TgQfzEovHFlpbqw52Lv4L2uzixUDMatm6ASw46Atr8p0dCkYRhesQgedJAiN5mymkCeR1jU13LiZ70DZczYAvu9LAbhXdMvd54Q082mtqWffuYZIW0FYiQ0iRcry2M1G6SFpqBsM5Vkihr4sjhixv9FPSICTGmbNWomgb5pbUiLaOdSYLhGaRP5E8e0eTlaLuJjtwAmibDDL5ZqxATPsfoPm3DMJzv6IbHKfyGVouHut4qo4hN7qYcZP3Ebfo0dqnBbvVBiYEL32xzV5wpvX9ulb3t0jRfmxpvyjRb9R6mbve7Aawxy666pw9YJFPKYx2gF64PtOLhSLfLanGvu62PTR3ocSCRPy6Y8xBcLnWm0ZZiJfcYfvmAl9512rwSuxJh3rBekUIjNrCUaNGcqBEWpB7XqBASczSpFa6j1ao6bjRo3p5vtYgAuhTqlgTj2xcpMHfRdvBcsXjwiQMqru1ydi3vZBaoXHZWdckzcov4RQF4E9HWK6ETzUc45oWnisBOY9pPK482i4cSFr6yx8FfyVptf4I5wJlKikMbINKbbmTDS03QYwrKKM0mrSPz1B3