
▫️ Ten Stocks Now Make Up a Third of the S&P 500.
The top ten names are near double their historic weight, and most index owners have no idea.

▫️ THE CORE TOPIC
For decades, buying the S&P 500 meant buying breadth. Five hundred companies, many industries, risk spread across the whole economy. Diversification came built in. That was the entire point of the index.
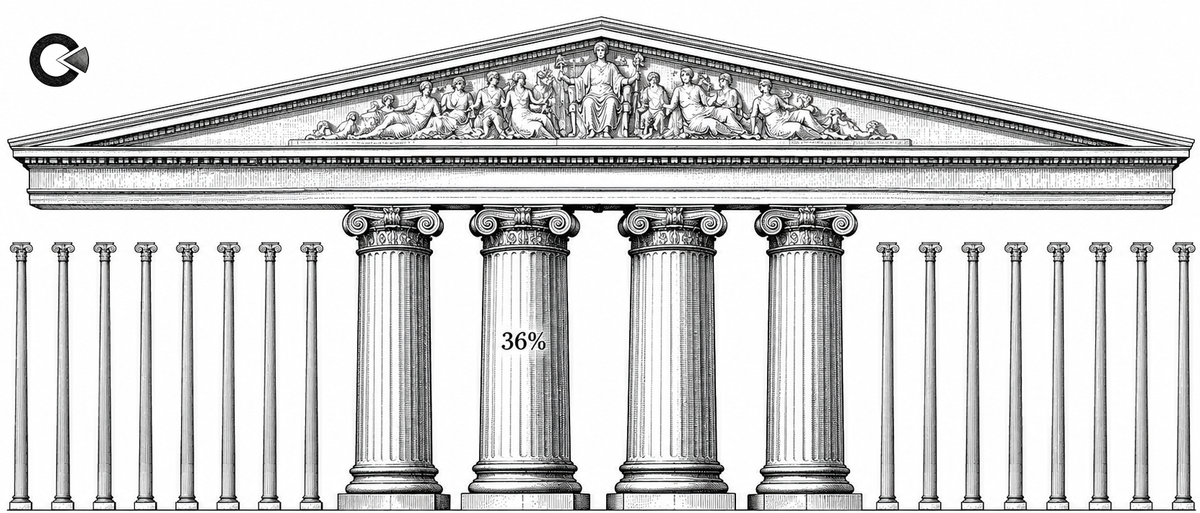
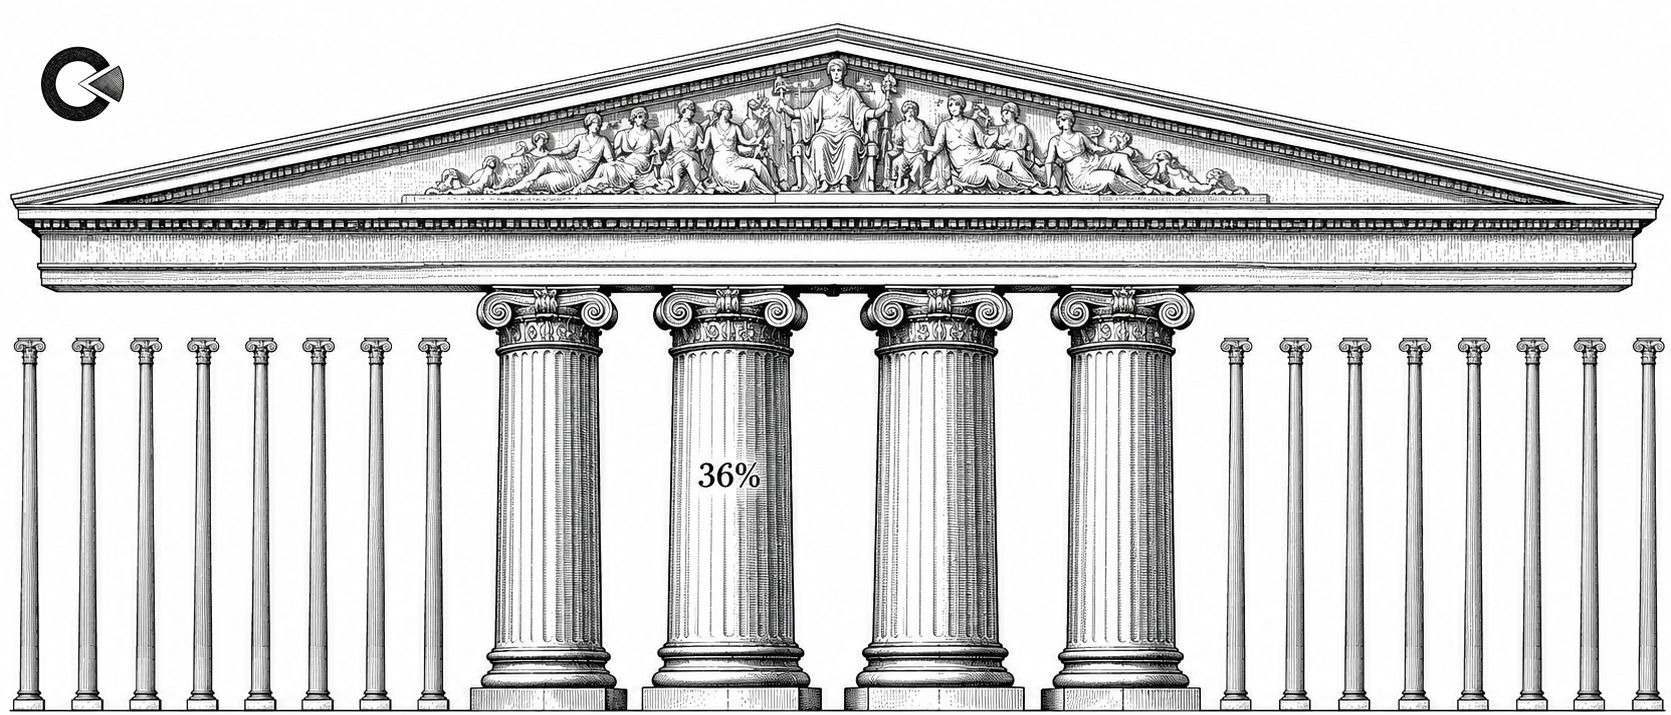
That is no longer true. The ten largest companies now make up roughly 36 percent of the S&P 500, close to double the 18 to 23 percent that held from 1990 to 2015. By one measure, the index now behaves as if it held just 54 equally weighted stocks rather than 500. A few names move the whole market.
The driver is passive flows. Every dollar into an index fund buys the biggest names first, which lifts their weight, which pulls in still more money. Size now feeds on size, with no judgment about price attached.
The giants are real businesses. Even one of them, Tesla, holds billion-dollar divisions most index owners never notice. But when you buy the index today, you are mostly buying the top ten, and the safety of breadth is far thinner than it looks.
▫️ THE MECHANISM
Concentration reaches your portfolio through a few connected gears.
- The passive loop. Index funds buy the largest names first, lifting their weight, which draws in still more buying, regardless of price.
- Shared risk. When the top names all share one theme, today it is AI, they tend to rise and fall together rather than offset one another as a broad index should.
- Hidden single-stock bets. A standard index fund can now hold more in one company than it holds in several entire sectors combined, so a single earnings miss can swing the whole fund.
- Thin breadth. When only a few names carry the index higher, the average stock can stall or slip while the headline number still climbs, masking real weakness underneath.
- The hunt for the next thing. This same concentration pushes some investors to look past the giants toward tiny companies tied to strategic materials, chasing the growth the index no longer delivers.
Diversification on paper is not always diversification in practice.
▫️ THE CASE FILE
In the early 1970s, investors crowded into the Nifty Fifty, a group of about fifty large, admired growth stocks treated as one-decision holdings you could buy and never sell. Their dominance felt permanent, and money kept flowing to the same names.
By 1972, some traded at 50 to 90 times earnings. Then the 1973-74 bear market arrived. Many of those names fell 60 to 80 percent, and several took a decade or longer to reclaim their highs. The companies themselves mostly survived. The prices did not.
The lesson was not that the giants were frauds. It was that price and crowding had drifted far from value, and the correction found every one of them at once.
▫️ THE PRESSURE TEST
- Concentration can persist. Crowded leadership can run for years before it unwinds. Being early and being wrong look identical for a long time.
- The leaders earn real money. Unlike 2000, today's largest names are deeply profitable, which can justify part of their premium.
- Timing the turn is hard. No one rings a bell at the top, and stepping out too early carries its own cost in missed gains.
- Breadth can return. A healthy broadening, where the other 490 companies catch up, is also possible and would ease the risk.
The point is not to fear the index. It is to know exactly what you own, and to anchor part of your capital in assets that do not depend on ten stocks staying perfect forever.
▫️ AUTHOR'S LENS
I have seen this movie before. In the late 1990s, a small handful of names were going to run forever, and owning them felt like safety itself. It turned out to be the opposite. Crowding always feels like consensus, right up until the moment it feels like a trap.I do not avoid the giants. I just refuse to let a market of ten companies decide my entire outcome. I keep a foundation outside the index, in things that still hold their value when the crowd finally turns.Build the structure. Ignore the noise. |  |
▫️ PAST ISSUES

Click to access past briefings, conclusions, and charts. Analytics updated weekly for structural analysis and market understanding.
nGPzs4iCDSN7nuSGEFugQapbGSNAEowpvHoWI14WK7y06K0kNCF0234lzGa26XJIHHEBCDKng9uIn1ePi5ZJE0gZBGmhWzn7MfH3WopiQulSds7YzfWmuxAPPFxkHGHoRvA5ZxcHbxvozXHD434Wkaen4cdUycd67m7CeeFGXGuGg6GOzmEF6LQBG2ZkRMz1jgOljxEhUS7odfnt9J7msjOv7zgqDPpVeMlRBTwSNbLzltT2C7pI2cQLfiC1tvxTsLYat6W9Odwx26RGCIcAYVsz1wm61FsaHEGSLPt3Pk3hZ3H5syzfM4le0ZJcWeaLwuZZw3YE29KpUOWdshxFnNeyNpOBuqmheSWGtlhQgBM4xDwNnbuNecxgP3hfCcKsJdicfRI7wRxWtgw5YSPOeV8Nmuod5c4UI8kUocmB0hPh3aUnpW2222DyykeDGTJH2VI1PdxdSHz1W6CuIGBBM7HNtsqmIWc3UCRvP158QPsvyXkwCWAB4dqgozUpVehNlUJlUkcpSDDegiBWZn6IT80mRq5wQRkdvBFkdAoDyIfPun4xuA3gi3lsuULOqwt8ogJRIZaSxDgNq29RGsqqf45mabab4kTtWmC6AdCNS2khWekFAvbgOIeJbfSW7f7kBOUEuFqjnTgTxAExDQV7ZJEwy0SlgpSmhUY4EodoRor0KxT7XSqjB80sliUW7cKk9vilvpuW0EOorJvOyX9BaWgL2WlKcuIvTwnDFIWKOF6gsG9Xf3ud14XDQj5yWQnzdfZGrg5hfrEbaT8Ol5WmQmJ1OVHFDUhXyWy9OnyV9KTRMM4ZDa00z0dRO4OPXpgroRdlrttjcoFHVxA091BMvX0K3JQ0jEm4x87n4Is5kFSY2J21A74PYRINzHeIvs7hPEcTJGsxjXYZVqaHjZ2sPz3k3320aJwqA0UfaPZshD2KCfEND8Cec06FWhbg4B12s6Vy6TYPiP80camxKvBXXJ9Ec53KUr0jhgntjP95JRTPVTgczBaogawCOYYVYJkMTFTsghOkR0Ms2d6TpA8QXttilI8RqZMg1tay0e0v8y8s3GKUtFk9Zbt0rFAHZGTiepEov9yKYukxlF0oADw9KTSovWGo9IQFCOEAoNzZp5to7GdXUQoUoEOlGFXxEg2OT4aSdcl0kxgS2SYG16akg2ERzQyJ5nNLsKN9tGxyVFMYLL8v0AAYwKTF7JYeEwILSr7XT4THMWMyWfM78WJQewFNg98txAIqgplHIuBEdjqrY1Tzwo8yGgo5JdBeW0aOKL0NBhk1Z4G7MZTsYyYGBIDpS7Wh3ydtCKy4pGiEzlTkzIIpGTAK8ly5r4BVVez0KgmHMgCYqTs1JnONbqGkymhGYn57USm4ay1bjk1xA8pEhKdpvcwVoxvDxhT3IlFYNuHxp99hEVg0H6up1VDi7FQ7tebnVoWHXtH0HG3h4ibaRovlYPgyLPaOZQUgmOoCRLfth524Zv6Jn3Bji1qFe8oQcuQoniHPagfvxFEFEmed5dKc6SCrgxogr9FpBfMv2fdICHo3cJzPLuLDzUKoDIV6LG6OBoJHbupFgQFM60SgAF2FMopaWRtLTHU7ZyQgZBROtXHrQ7Wf2pAHRPM8H4FtW2ojLh4EE2rrkj7ZzF0x3wgJvVswIyNoHsZ3hV7lg3vmXI2MXJDaXpuNeDgXTGN6OQXaXrWq1ETp08Qtwpt1BxlNfBRKzDQSidQiqO3OCHdakGOv0iM1mLcuVyMfcaPIyNtYA0NyBqGE3kz93RDJeSTfJFdhEKcb4wq9CIX9vy5gdpROjIUVfUkcLa9LQeC6BOT6d1Ap6AYDtnWeaO46Ht8Opa6EujuZCC8MPLiIuvjqQjAAdpDm2WG3VVh2isESiLqPFS6b0GmJRVNk9hiOBfsIsHuNEzaIiLge